Project:Ircensus: Difference between revisions
From London Hackspace Wiki
No edit summary |
m (Updated lamarr stuff to landin.) |
||
| (4 intermediate revisions by the same user not shown) | |||
| Line 5: | Line 5: | ||
Part of the [[Project:LHS Graphs and Visualizations|London Hackspace graphs and visualisations]] project. | Part of the [[Project:LHS Graphs and Visualizations|London Hackspace graphs and visualisations]] project. | ||
Currently this daemon is running on [[Equipment/Landin#Chomsky|Chomsky]] | |||
==Overview== | ==Overview== | ||
There is a bot with the nickname 'ircensus' in the #london-hack-space channel that collects data on the following: | There is a bot with the nickname 'ircensus' in the #london-hack-space channel that collects data on the following: | ||
| Line 11: | Line 12: | ||
* Total users | * Total users | ||
This bot is written in Java and runs on [[ | This bot is written in Java and runs on [[Equipment/Landin#Chomsky| Chomsky]]. It has an HTTP interface that outputs: '''<tt>london-hack-spaceMessages:5 london-hack-spaceActiveUsers:2 london-hack-spaceTotalUsers:102</tt>''' | ||
http://localhost:42002/ | |||
These stats feed into our local cacti graph instance to plot activity trends. | |||
==Code== | ==Code== | ||
The source code is [https://github.com/londonhackspace/ircensus available on GitHub]. | The source code is [https://github.com/londonhackspace/ircensus available on GitHub]. | ||
Latest revision as of 18:10, 23 November 2018
| Ircensus
| |
|---|---|
| Members | Elliot |
| QR code | |
Part of the London Hackspace graphs and visualisations project.
Currently this daemon is running on Chomsky
Overview
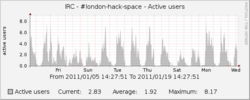
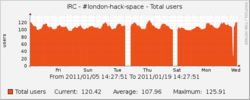
There is a bot with the nickname 'ircensus' in the #london-hack-space channel that collects data on the following:
- Active users (/5min)
- Number of messages (/5min)
- Total users
This bot is written in Java and runs on Chomsky. It has an HTTP interface that outputs: london-hack-spaceMessages:5 london-hack-spaceActiveUsers:2 london-hack-spaceTotalUsers:102 http://localhost:42002/
These stats feed into our local cacti graph instance to plot activity trends.
Code
The source code is available on GitHub.


